A timed-out request kept a server busy under the next question, and nobody noticed for half an hour.
During a paid evaluation run, a driver timed out on one question after 30 minutes and started the next question on the same server, which was still processing the abandoned request. Monitoring went quiet. Cost attribution became unreliable, because two questions were now drawing on the provider at once. The overlap was only noticed by querying the provider's telemetry by hand.
The rule I already had for such runs was simple: check every five minutes, and stop on the first decisive failure. The trouble with a rule like that is that it lived in my head, or in the agent's attention, and an agent's attention is exactly the thing that drifts during a long run. Run Sentinel is that rule as code: one timer, a log watch, a kill on a pattern, and the cost rate on the status line.
What it does
You arm a watch on a log file:
/sentinel start <log> [--kill-on <regex>] [--report <regex>] [--metric "<cmd>"] [--pgid <n>]
Only lines written after arming are considered, so an old failure in the log does not trip it. Then, on each tick, every 300 seconds by default:
- new log lines matching the
reportpattern are logged to the session, so completions and failures are seen as they happen; - a line matching the
kill-onpattern terminates the process group given bypgidwith SIGTERM and notifies you. With nopgidit notifies and asks you to stop the run yourself; - the
metriccommand is run, and its number and the change since the last tick go to the status line.
That last one is the cost control. Point the metric at a count of provider calls and you can see the spend rate without leaving the session, and spot the moment it doubles because two questions are running at once.
/sentinel status shows what is armed, and /sentinel stop [<log>] disarms a watch.
Setup
Defaults live in a small file in the project, committed with it so every session and every subagent sees the same values:
{
  "report": "Traceback|Error|FAILED|\"outcome\"|RUN_DONE",
  "killOn": "\"outcome\": \"timeout\"",
  "metric": "docker exec db psql -U postgres -At -c \"select count(*) from llm_call_telemetry\""
}
The interval is set in the plugin's configuration menu. Start the run in its own process group, with setsid or a subshell, and pass its id as --pgid, so the kill reaches the server and the driver together rather than leaving one of them running.
Installing it
Install once, at the user scope, from a Claude Code session:
/plugin install run-sentinel --marketplace William-Harvey/run-sentinel
Answer yes to add the marketplace, then pick the scope. From a shell:
claude plugin install run-sentinel --marketplace William-Harvey/run-sentinel
In the desktop app, click the plus next to the prompt box, choose Plugins, add the marketplace William-Harvey/run-sentinel, then add the plugin. To try it without installing, load it straight from a clone:
claude --plugin-dir <path to the plugin folder>
Start a session in the project and the plugin's commands appear under /, with its hooks active for the session and every subagent it launches.
Two things to know
The timer is created at session start and survives individual commands, but reloading the plugin drops the armed watches, so arm them again afterwards. And reading a very large log every tick is linear in its size, so rotate logs on multi-day runs.
Why I'm sharing it
Long paid runs under an agent's supervision need a watchdog that is not the agent's attention: a fixed interval, a hard stop on a failure pattern, and a cost rate on the status line. I needed it the night a timed-out request kept a server busy under the next question. The log patterns, the kill rule and the metric command are yours to set. The plugin only keeps time and acts on what you declared.
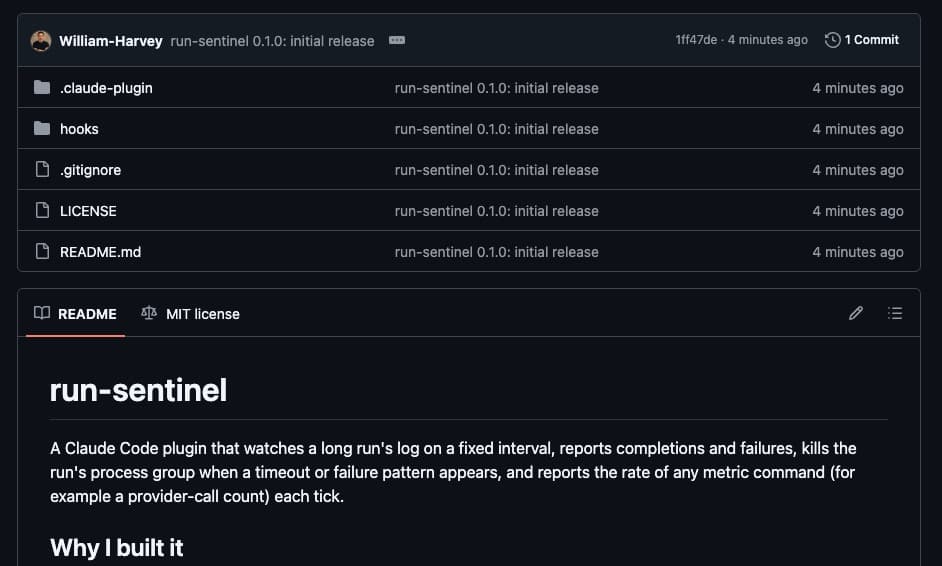
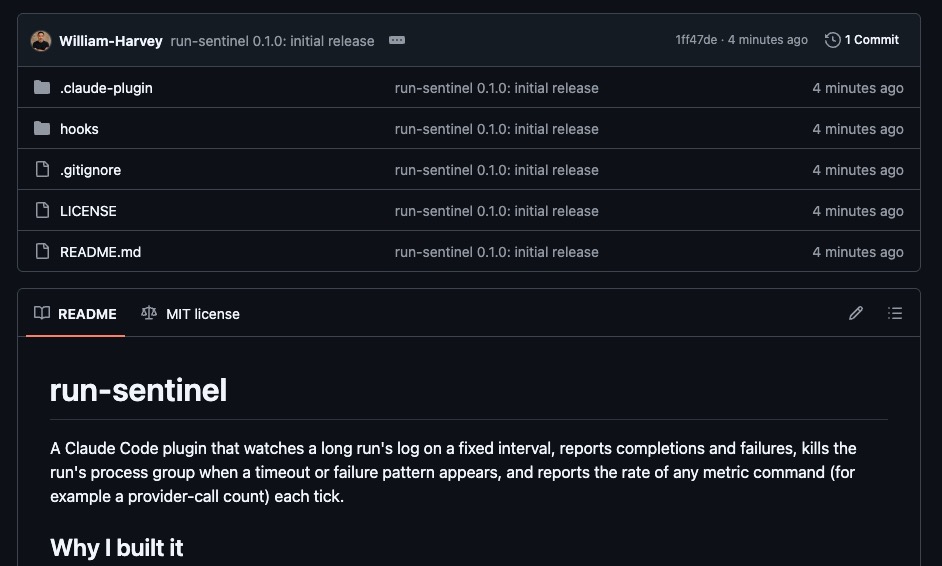
It is on GitHub under the MIT licence at github.com/William-Harvey/run-sentinel.